1
Deploy Multi-Point Quality Measurements
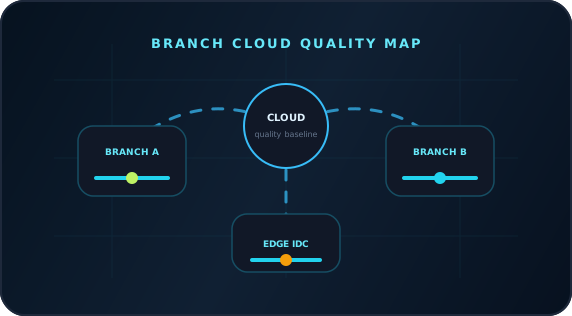
Place BestPerf tasks at headquarters, key branches, VPCs, data centers and edge nodes to build a matrix by region, carrier and application path.
Solution Detail
BestPerf Network Quality Measurement + Flow Hunter Network Traffic Analysis
Detect degradation across branches, clouds and data centers and isolate causes to links, DNS, TLS, HTTP, servers or clients.
Core Emulation Equipment
Optional Supporting Tools
Products
3
Scenarios
6
Evidence
PCAP
Why
Headquarters/branch, cloud-edge, data center/cloud and active-active paths cross carriers, regions and security boundaries. Slow access requires distinguishing branch exits, carriers, cloud entrances, firewalls, DNS, TLS, servers and clients.
BestPerf schedules multi-site measurements and trends. Flow Hunter analyzes real sessions at affected points. ChaosBridge reproduces characteristic degradation in the lab.
Topology
How
Place BestPerf tasks at headquarters, key branches, VPCs, data centers and edge nodes to build a matrix by region, carrier and application path.
Set RTT, loss, jitter, micro-outage and TCP throughput baselines/thresholds to identify periodic congestion, carrier degradation and regional anomalies.
Use Flow Hunter at branch exits, cloud entrances or core switches to inspect DNS, TCP, TLS, HTTP and retransmissions in slow sessions.
Recreate typical profiles with ChaosBridge to test timeouts, retries, CDN/SD-WAN policies and link optimizations.
Product Stack
Core Emulation Equipment
Optional Supporting Tools
BestPerf
Actively measure RTT, directional loss, jitter, micro-outages, TCP goodput and quality under load to establish link baselines.
Flow Hunter
Capture passively through mirrored ports or TAPs for L2-L7 analysis, session investigation, protocol-stage diagnosis and PCAP export.
Result
View trends by region, carrier, cloud entrance and application path to identify the scope of degradation quickly.
Combine active metrics and real sessions to distinguish link, protocol-stage, server and client issues.
Deliver more than throughput or delay figures: include topology, parameters, timelines, quality curves, key sessions, anomalies, PCAP extracts and retest results. Development, testing, operations, vendors and customers can discuss the same evidence rather than relying on screenshots, verbal descriptions and repeated debate.
References
Next Step
NetAccura can create a test topology, parameter table and POC plan based on your links, models, application protocols, available PCAPs and SLA goals.